College Success Award methodology archive
2019 College Success Award methodology
Background
The objective of the College Success Awards is to recognize and celebrate public high schools that are successfully preparing students to succeed in college. Award winners are determined by a methodology that evaluates school-level data on college preparation, college enrollment, and college performance.
States included
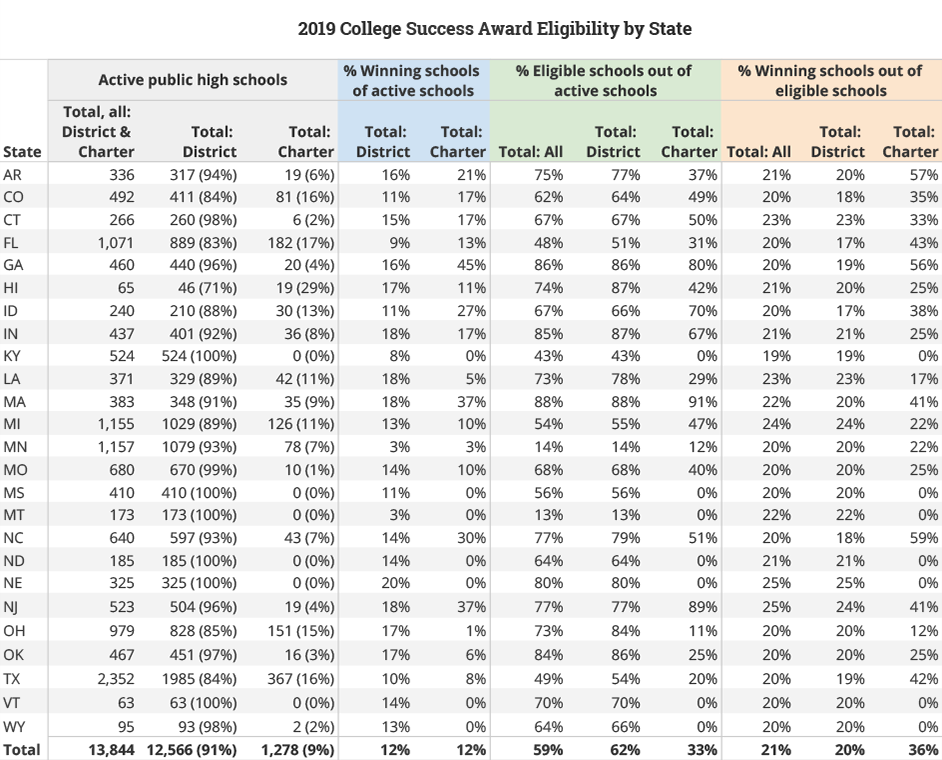
After a national data collection effort, GreatSchools.org collected sufficient data to calculate the award in 25 states: Arkansas, Colorado, Connecticut, Florida, Georgia, Hawaii, Idaho, Indiana, Kentucky, Louisiana, Massachusetts, Michigan, Minnesota, Mississippi, Missouri, Montana, Nebraska, New Jersey, North Carolina, North Dakota, Ohio, Oklahoma, Texas, Vermont, and Wyoming.
Eleven of the states where schools are eligible for a 2019 College Success Award provided additional data on measurements of college success for low-income students, which allowed GreatSchools.org to review the schools’ college-success efforts with a greater lens on equity. The states providing this additional subgroup data for students receiving free and reduced-price lunch are Connecticut, Georgia, Indiana, Kentucky, Louisiana, Massachusetts, Michigan, Mississippi, Nebraska, New Jersey, and North Dakota. For more information about state-by-state eligibility rates, see Appendix A.
Data included
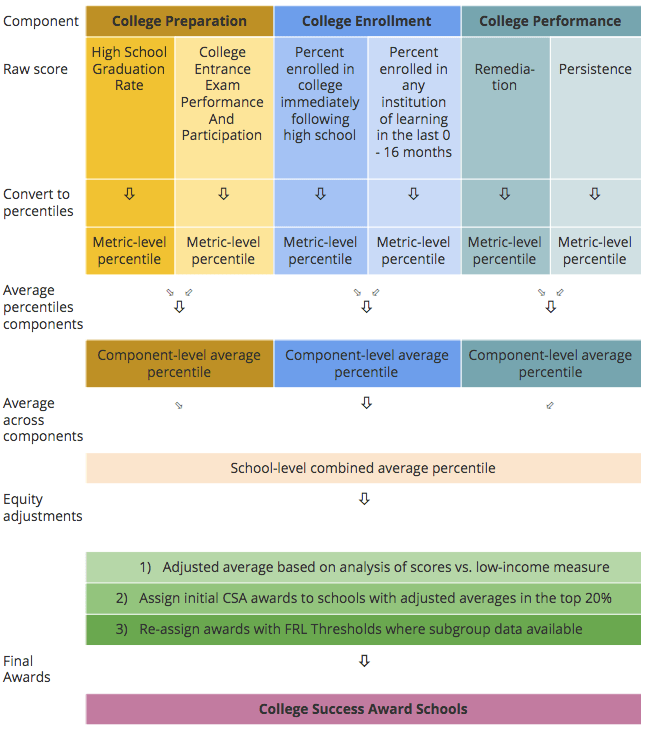
Award winners are determined by calculating a school-level score and applying a threshold to delineate which schools receive an award and which do not. This school-level score is comprised of three components:
- The College Preparation component includes the percent of students from a 4-year cohort who graduate from high school, the SAT or ACT participation rate, and the average performance on the SAT or ACT.
- The College Enrollment component component includes school-level metrics that vary by state. Some states report this data as “Percent Enrolled in College Immediately Following High School,” others as “Percent enrolled in any institution of higher learning in the last 0-16 months,” or “Graduating seniors pursuing either a 2-year or 4-year college/university.”
- The College Performance component component includes remediation and persistence metrics, which also vary in availability by state. The remediation metric is “Percent of students needing remediation for college” and is sometimes disaggregated by subject. The persistence metric is “Percent enrolled in college and returned for a second year.”
Data limitations
There are three principal limitations to the data:
- College enrollment and persistence data do not take into account institution quality, thus college preparation data is included as a proxy for quality.
- In some states, data are not disaggregated by subgroup, so results may not be equally distributed across groups. When disaggregated subgroup data is provided by states, we calculate college success metrics for students receiving free and reduced-price lunches (FRL subgroup) and incorporate this data for low-income students into the methodology.
- Data are “point in time” data, not longitudinal data, so results will not necessarily isolate the value added by the school from any out-of-school factors that may be influencing performance.
Award calculation methodology
Initial score calculation methods
First, each of the inputs available for a particular school is standardized. To do this, the school’s position in the statewide distribution for each metric is calculated as a percentile.
Some states mandate that a specific college entrance exam is taken by all high school graduates. In these states, if data for multiple college entrance exams is obtained, only the data for the mandated exam is used. In states that do not require a specific exam to be taken, and there is data for more than one college entrance exam available, the data for the exam with the higher participation rate statewide is used. If participation rates are not available, the exam on which the school’s students performed better is used.
Within each component, we calculate an average of the percentiles of the available metrics, resulting in a score for each of the three categories (College Preparation, College Enrollment, College Performance) for each school. This approach ensures that we give equal weight to all three components in the final school-level score. For schools with no available data in one of the metrics, the average across the other metrics is taken. For example, if a school does not have graduation data, then the College Preparation component’s average percentile is based only on College Entrance Exam Performance and Participation data.
The last step in calculating the single school-level score is to calculate the average of the subscores of the three components. To limit the advantage of missing data, schools that do not have data in all three categories are considered ineligible for the award. Once these schools are removed, the eligible schools in each state receive a single school-level score calculated from the three components. We adjust the single school-level score to account for student income levels during the subsequent equity-focused score adjustments.
Equity-focused score adjustments
To ensure that GreatSchools.org’s 2019 College Success Awards recognize success through different lenses, including equity, we revised the 2019 College Success Award methodology to identify schools that are “beating the odds” by better serving low-income students who might otherwise not be prepared for or attending college. Our equity-focused methodology includes: 1) adjusting a school’s single school-level score based on how the school performs relative to expected levels based on their low-income student enrollment to create a final College Success Award score for each school; 2) assigning awards to the top 20 percent of schools based on those scores; and 3) calculating the school-level scores for low-income students in the 11 states where low-income student subgroup data is made available. Schools in the top 25 percent for low-income students statewide (whether or not the school was previously awarded) are included; schools in the bottom 50 percent for low-income students statewide (even if the school was previously awarded) are disqualified.
We adjusted the average College Success Award scores to boost the rankings of schools that are better serving low-income students. We estimated how well a school would do by exploring the relationship between average school-level scores and student income levels and awarded schools credit for doing better than predicted. After calculating the adjusted scores for each school, we awarded the top 20 percent of schools based on this final College Success Award score.
Finally, for states providing low-income student subgroup data, we applied thresholds based on the performance of low-income students at each school. Using the same methods as for initial overall College Success Award scores, we calculated College Success Award scores for low-income students (defined as those enrolled in Free and Reduced-price Lunch programs) in the 11 states that provided subgroup performance data. We adjusted the award assignments in these states based on low-income performance thresholds of 50 percent for low scores and 75 percent for high scores. For schools earning initial awards based on adjusted scores, schools retained the award if low-income subgroup performance is in the top half of scores for low-income students in that state. If the low-income subgroup performs in the bottom half, then the award is removed. For schools not earning awards in the initial steps, if low-income students at a school perform better than 75 percent of the low-income students at other schools in the state, the school earns the final College Success Award. Award assignments are not altered by these methods for schools in states where low-income student subgroup performance data are not available. All schools earning awards after the equity-focused methodology is applied are the final College Success Award winners.
A visual of the methodology
2018 College Success Award methodology
Background
The objective of the College Success Award is to recognize and celebrate high schools that are doing the best at preparing students to succeed in college. Award winners are determined by a methodology that evaluates school-level data on college preparation, college enrollment, and college performance.
States included
After a national data collection effort, GreatSchools collected sufficient data to calculate the award in nine states: Colorado, Florida, Kentucky, Indiana, Georgia, Ohio, Michigan, Arkansas, and Missouri.
Data included
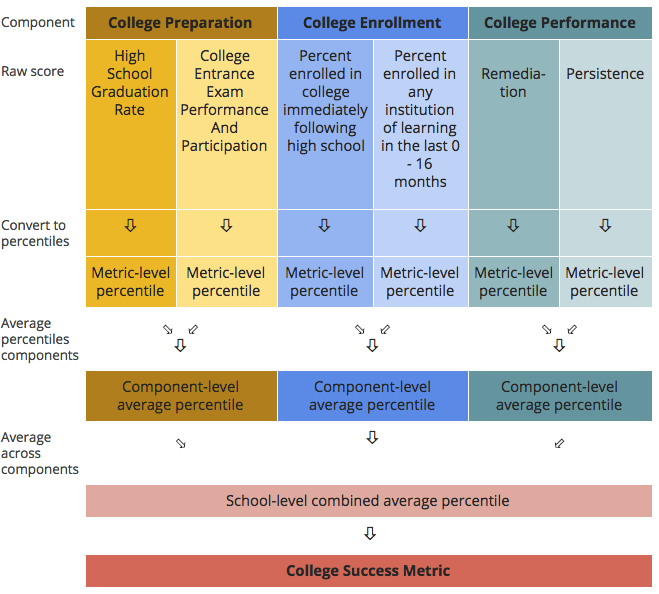
Award winners are determined by calculating a school-level metric and applying a threshold to delineate schools receiving the award and those that are not. This metric is comprised of three components:
- The College Preparation component includes the percent of students from a 4 year cohort who graduate high school and the average performance and participation for the SAT or ACT.
- The College Enrollment component includes school-level metrics that vary by state. Some states report this data as ‘Percent Enrolled in College Immediately Following High School,’ others as ‘Percent enrolled in any institution of higher learning in the last 0-16 months,’ and ‘Graduating seniors pursuing either a 2-year or 4-year college/university.’
- The College Performance component is comprised of remediation and persistence metrics, which also vary in availability by state. The remediation metric is ‘Percent of students needing remediation for college’ and is sometimes disaggregated by subject. Persistence metric is ‘Percent enrolled in college and returned for second year.’
Data limitations
There are three principal limitations with the data:
- College enrollment/persistence data do not take into account institution quality, thus college preparation data is included as a proxy for quality.
- Data are not disaggregated by subgroup, so results may not be equally distributed across groups.
- Data are “point in time” data, not longitudinal data, so results will not necessarily isolate the value-add of the school from out-of-school factors influencing performance.
Methodology
First, each of the inputs available for a particular school is standardized. To do this, the school’s position in the state-wide distribution for each metric is calculated as a percentile.
Some states mandate that a specific College Entrance exam be taken by all high school graduates. In these states, if data for multiple College Entrance exams is obtained, only the data for the mandated exam is used. In states that do not require a specific exam to be taken, and there is data for more than one College Entrance exam available, the data for the exam with the higher participation rates statewide is used. If participation rates are not available, the exam in which the school performed better is used.
Within each component, an average of the percentiles of the available metrics is calculated, resulting in a score in all three categories (College Preparation, College Enrollment, College Performance) for each school. This approach ensures that equal weight is given to all three components in the final for calculating a school’s level metrics. For schools with no available data in one of the metrics, the average across the other metrics is taken. For example, if a school does not have graduation data, then the College Preparation component’s average percentile is based only on College Entrance Exam Performance and Participation data.
The last step in calculating the single school level metric is to average the scores in the three buckets. To limit the advantage of missing data, schools that do not have data in all three categories are considered ineligible for the award. To ensure that only schools that are performing well are identified, schools that perform below the 50th percentile and below the weighted average in a metric in their state are also ineligible. Once these ineligible schools are removed, the top 30% of all schools from each state that are left are the College Success Award winners.
A visual of the methodology
1 The availability of College Enrollment metrics varies by state.
Appendix A